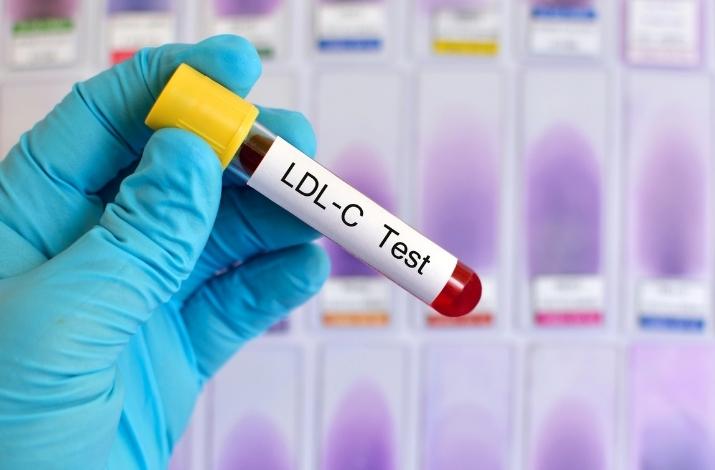
When it comes to LDL, size matters

Dyslipidemia is a state of having an abnormal amount of lipids (fats) in your blood. Usually, this is defined by simply having too much lipid (e.g., hyperlipidemia), but it can also indicate that the usual levels of the various lipids are simply out of order. The main lipid players are the usual suspects: triglycerides (TG), low-density lipoprotein (LDL) and high-density lipoprotein (HDL) cholesterol.
The clear cultural (dogmatic) consensus is that LDL cholesterol is the villain among the lipid list of suspects, and while there are certainly data to support that conclusion [1], there are many, many studies that suggest otherwise [2,3]. The controversy surrounding the lack of consistent evidence to support the theory that LDL is as lethal as we once believed may have to do with how we measure it.
LDL cholesterol, or more accurately the lipoprotein that carries the cholesterol, comes in various sizes and densities and measuring this is getting easier and easier to do. We now know (and have for a while) that LDL is more relevant when it is categorized by size and density, which we refer to as a “pattern”. There are two patterns, A and B, that each represent the ends of a spectrum where A refers to a lipoprotein molecule that is large and less dense, while B refers to the lipoprotein being smaller and denser. When we consider that for the cholesterol carrier to be pathogenic it must pass from the blood and into the blood vessel wall, we can appreciate that the smaller, denser lipoprotein would do this more easily. If this doesn’t make sense, let’s use an analogy. Imagine you are standing on a bridge above a river. In your left hand, you’re holding a beach ball (i.e. LDL A; more buoyant, less dense); in your right hand, you’re holding a golf ball (i.e. LDL B; less buoyant, denser). As you drop both balls, what would happen? The beach ball (i.e. LDL A) would float along with the river, while, as any golfer knows, the golf ball (i.e., LDL B) would drop to the bottom, bouncing along the riverbed. LDL A and B act in a similar way; LDL A tends to interact with the blood vessel wall less frequently than LDL B. And LDL can only drop off its fats and cholesterol when it bumps into the blood vessel well. Thus, it’s not surprising that people with LDL pattern B are remarkably more likely to experience cardiovascular complications than people with pattern A [4].
However, at this point, determining LDL size is still not a common part of typical blood tests, which usually just includes the main three players with regards to lipids: TG, LDL, and HDL. Interestingly, however, we can use two of those numbers as a highly accurate indicator of LDL size—a “poor man’s” method. By dividing TG by HDL (TG/HDL), we get a ratio that is surprisingly accurate in predicting LDL size. The lower the ratio (e.g., ~<1.5), the more prevalent the larger, buoyant LDL particles, (i.e., LDL pattern A predominates). But as the ratio climbs (~>2), the small, dense LDL particles become more common (i.e., pattern B predominates) [5]. Again, the benefit of this ratio is that virtually every blood test will include these two variables (i.e., TG and HDL), which means we can readily get an idea of our individual LDL pattern type.
But what does all this have to do with insulin resistance? Insulin selectively drives the production of LDL pattern B from the liver (where almost all cholesterol is made), and as insulin levels steadily climb with increasing insulin resistance, the liver is getting the signal to shift the individual towards a pattern B LDL profile [6,7]. Ultimately, the connection of dyslipidemia to cardiovascular problems is thought to be through the reduced diameter of blood vessels due to the accumulation of the lipids in the blood vessel walls, leading to atherosclerosis. In the end, improving blood lipids is another reason to focus on keeping insulin resistance in check.
References
- Wilson, P.W., et al., Prediction of coronary heart disease using risk factor categories. Circulation, 1998. 97(18): p. 1837-47.
- Barter, P., et al., HDL cholesterol, very low levels of LDL cholesterol, and cardiovascular events. N Engl J Med, 2007. 357(13): p. 1301-10.
- Schatz, I.J., et al., Cholesterol and all-cause mortality in elderly people from the Honolulu Heart Program: a cohort study. Lancet, 2001. 358(9279): p. 351-5.
- Lamarche, B., et al., Small, dense low-density lipoprotein particles as a predictor of the risk of ischemic heart disease in men. Prospective results from the Quebec Cardiovascular Study. Circulation, 1997. 95(1): p. 69-75.
- Fan, X., et al., Triglyceride/high-density lipoprotein cholesterol ratio: a surrogate to predict insulin resistance and low-density lipoprotein cholesterol particle size in nondiabetic patients with schizophrenia. J Clin Psychiatry, 2011. 72(6): p. 806-12.
- Selby, J.V., et al., LDL subclass phenotypes and the insulin resistance syndrome in women. Circulation, 1993. 88(2): p. 381-7.
- Reaven, G.M., et al., Insulin resistance and hyperinsulinemia in individuals with small, dense low density lipoprotein particles. J Clin Invest, 1993. 92(1): p. 141-6.
This article is for informational and educational purposes only. It is not, nor is it intended to be substitute for professional medical advice, diagnosis, or treatment and should never be relied upon for specific medical advice.


